Chip Royce, Flywheel Advisors
Executive Summary: Economic data suggests the ups and downs of the marketplace. Most sources lag actual economic conditions. However, one source, The Economic Cycle Research Institute (aka ECRI), has much more accurate indicators and can predict future economic conditions, allowing managers to make more investment and planning decisions.
I consume a ton of news and research to feed my interest in investing and macroeconomics.
One source, the weekly MacroVoices podcast, interviews a wide range of opinions in macro investing. Through that show, I became aware of the Economic Cycle Research Institute and one of its leaders Lakshman Achuthan.
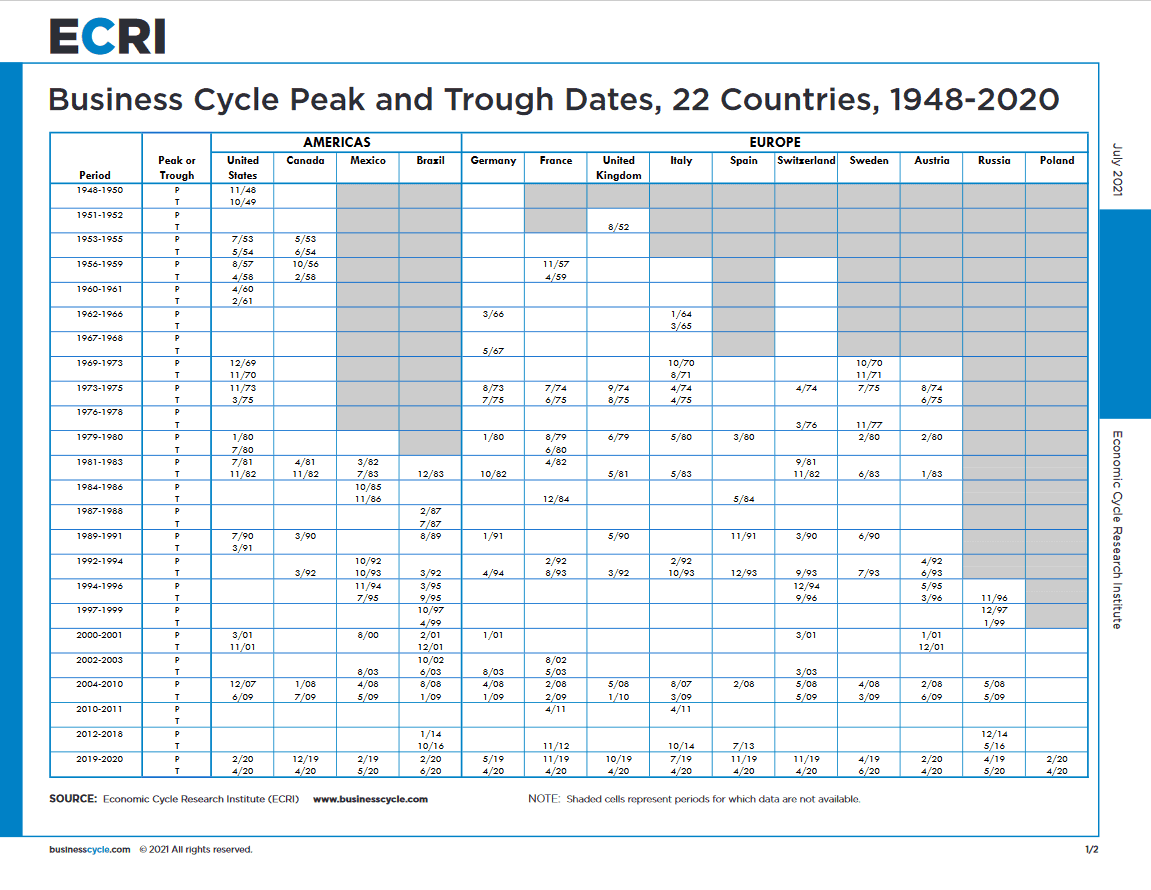
ECRI is an exciting company. Founded in 1920 as the National Bureau of Economic Research (NBER), the firm studied business cycles, providing research to the US government and private businesses related to economic forecasting and outlooks. ECRI spun out of the NBER and now tracks data on over 100 proprietary indexes covering 22 countries. Their customers are primarily large companies that use the data to make forward-looking investment decisions based on the intersection of their business trajectory and the business cycles in the industries and countries in which they do business.
Access to ECRI’s reports is costly. However, a few bits of information are made public promptly. At the end of this article, I’ll share how you can track ECRI data from public sources.


Differences Between Business Cycles and Recessions
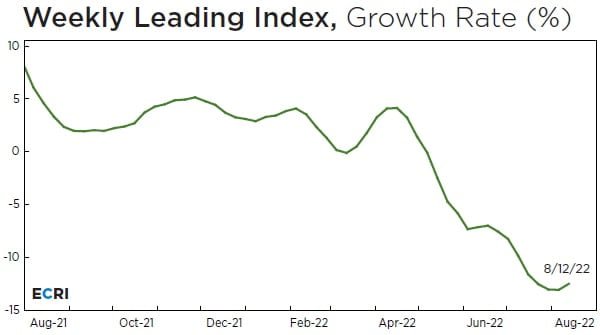
The principals of ECRI are quick to point out that a down business cycle does not necessarily mean a recession will occur. Similar to the PMI and other indices, the ECRI Weekly Leading Index shows the rate of change in economic activity. These cycles are naturally occurring in business and end up with a “peak” and “trough” that can be felt by businesses.
What is Different About ECRI Data?
ECRI’s data is different than other economic data like unemployment, interest rates, or manufacturing or service indices in that it is forward-looking, not backward-looking.
With ECRI’s data, you can glimpse what is happening today and next month. Something you really don’t have anywhere else.
I’m a Small Company, Why Should I Care About ECRI’s Data?
Your company may be small, but your business is not isolated from the greater economy. Your customers may be in economically sensitive industries. Or, if you sell to small businesses (SMBs), those firms will likely be impacted as well.
Monitoring this information is important as you get an early warning system as to positive cycles that you can
How Can I Use This Information?
First, collect ECRI data from public sources (see below).
Second, plot this data against key performance indicators (KPIs) that you measure your business against. This could be revenue, leads, website page views, and store traffic.
Third, analyze the data to look for strong correlations between ECRI cycles and your KPIs. Not everything will relate, but once you have sufficient history and can find the connections…
Fourth, monitor ECRI data weekly and use the data as an early warning system. If you see a peak and downturn, this is a signal to adjust resources and capital. If you see a trough, this may be an opportunity to start to invest in growth ahead of the competition.
Where Can I Find FREE ECRI Data From Public Sources?
Here’s a list of different sources:
- Visit the ECRI Website
- Lakshman Achuthan’s Twitter feed (@businesscycle – Lakshman posts a chart each Friday of the Weekly Leading Growth Index)
- Set up a Google Alert for Lakshaman Achuthan, he’s a frequent podcast and news guest.
- Do a google search for ECRI Weekly Leading Growth Index. There may be other sources of aggregated data.
Whenever you’re ready, there are 3 ways we can help:
1) Schedule 25 minutes to chat about your businesses: new opportunities, current challenges, aspirations, pretty much anything!
2) Sign up (if you haven’t already) for this newsletter.
3) Read back issues for more insights into how to (re)ignite growth for your company.